Statistical Tests
Test for Normality
src:wikipedia/Q–Q_plot
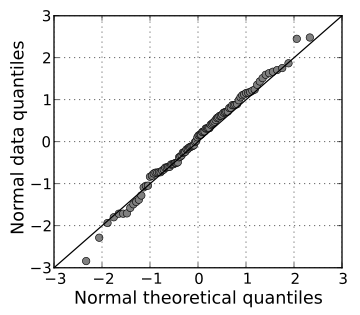
QQ plot of random normal data against a normal distribution
To get an indication on the shape of a distribution, or to compare to a given distribution, we can plot a histogram or a QQ-plot (quantile-quantile). When plotting a QQ-plot against a normal distribution, if all the samples fall close to the reference line, we can assume normality.
<ADD STATISTICAL TESTS FOR NORMALITY FROM ONENOTE>
Examples of Test Selection
- Is there a statistically significant relationship between participants’ level of education (high school, bachelor’s, or graduate degree) and their starting salary?
- Spearman
- Is there a statistically significant relationship between horse’s finishing position a race and horse’s age?
- Spearman